Subscription Fatigue is Real: Our Study on Video Streaming Confirms It
We surveyed 1000 people about their video streaming services subscriptions and learned that subscription fatigue is, in fact, a real thing: about 2 out of every 3 people surveyed have canceled at least 1 service in the last year.
We questioned people of all genders in North America between the ages of 15 and 67 about the streaming services they own and how much they pay – better yet, we asked which services they gave the ax and why.
In this post, we’re going to look at all the data we collected from our streaming service study and offer insights into what we learned along the way!
Here is a key summary of our findings

- Close to 2 out of every 3 people (64.92%) of the 1005 people we surveyed claimed they have canceled at least one video streaming service in the last year.
- The most popular services in North America are unsurprisingly Netflix which is used by 33.75% of respondents followed by Amazon Prime at 18.63%, Disney+ at 15.22%, HBO Max at 8.83%, and YouTube Premium at 6.01%.
- The most canceled streaming service reported in the last year is Amazon Prime at 9.46%, followed by Netflix at 8.55% and Disney+ at 8.33%.
- Most subscribers (37.42%) report canceling because a service goes unused and the next most popular reason to cancel (25.88%) is because a service is too expensive.
- The most common amount to pay for streaming services altogether per household a month is between $15 and $30 at 35.22%, followed by less than $15. It’s about a 50/50 split between those who think they’re paying too much (46.57% ) versus those who are content with how much they pay (53.43%). This spread changes when you examine each spending tier’s responses which we’ll discuss later.
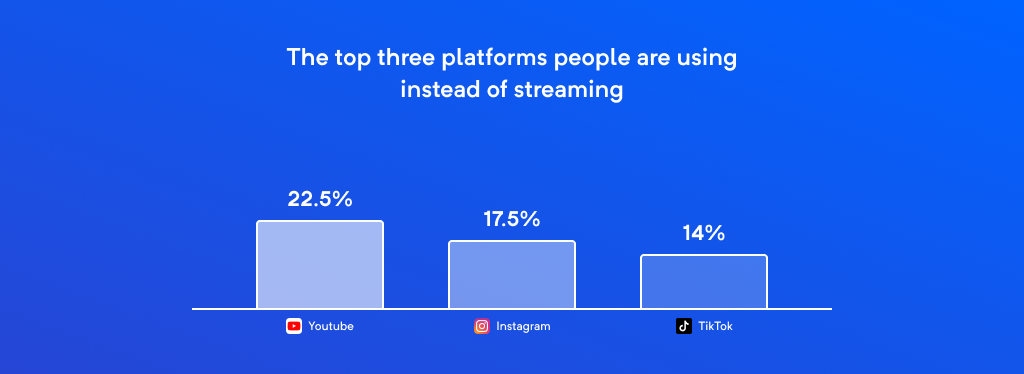
- Many respondents report seeking and using digital alternatives to paid streaming service providers. 22.42% of respondents report spending more time with YouTube’s free version, 17.49% are spending more time on Instagram, and 14.16% are using TikTok more frequently.
- When it comes to ads, 51.98% will deal with ads to enjoy a lower price point, but this number changes when looking at different age groups which we’ll also discuss later on.
We discovered several significant findings supporting our hypothesis that subscription fatigue is, in fact, real in addition to some other interesting facts about the market.
We have included detailed data and insights from our findings below.
Methodology for the Streaming Subscription Fatigue Survey
We designed a proper experiment using various digital tools to collect and analyze data (as a proper digital transformation agency should do for its clients).
For a more detailed explanation, you can check our methodology here.
What we learned from our survey
The pandemic put a squeeze on several things – we didn’t have much else to do so we bought stuff to keep us entertained like streaming services we could safely watch from the comfort of our own homes.
Fast forward to now, and we see that the market is adjusting to accommodate various conditions with reports like Netflix losing 1 million subscribers in Q2, a topic that our streaming fatigue report corroborates while adding some additional insights.
Let’s dive a little deeper and discuss some of the interesting bits of information we uncovered from slicing and dicing the data.
Nearly 2 out of 3 people canceled a video streaming service in the last year
We can confidently say that we’ve found concrete evidence of streaming fatigue:

The rapid adoption of various digital services during global COVID-19 lockdowns meant some took on more services than they planned to keep for long term. We learned that the majority of people who stream video content were more than happy to offload a service or two over the last year.
Who took the survey?
The demographic we targeted was “everyone” which made it fairly easy (and open) for people of all ages to take our survey, hence why we have a pretty wide age range, i.e., between ages 15 and 67, if you recall, of folks who managed to complete our survey.
The average age of respondents is 28 years old, which sleights the perspective of the survey data a bit towards the younger Millenial crowd, at least when looking at the data in its entirety.
Gender was split beautifully with 51% reporting as female, 48% reporting as male, and 1% reporting as non-binary.
When we shuffle the data to look at different ages and genders, we do see a few differences in a couple of datasets which we’ll point out as they become relevant.
The most expendable service reported was Amazon Prime
Amazon offers a ton of different services, substantially more than virtually every other service combined when you factor in their computing services/infrastructure, eCommerce platform, and shipping services.

And so too goes free shipping. | Source: Andrew Stickelman on Unsplash
Amazon Prime is the only other service that could be considered on the toes of Netflix with 200 million subscribers compared to the market leader’s 221.8 million subscribers.
Despite offering a variety of perks, Amazon reportedly canceled the most from all respondents with 9.46% giving the ax to not just streaming but free shipping and access to rotating free content on their streaming gaming service, Amazon Luna.

Having attempted to play a handful of games on Luna, and with the Amazon Luna Controller connected to a well-optimized, Wi-Fi 6 network, it’s no surprise this service doesn’t quite have what it takes just yet to keep users onboard.
Of course, we know that spending is down because of a combination of different circumstances currently impacting the global economy.
Online retailers that thrived during lockdown have been transitioning to meet a now more nominal market demand, a trend that’s further slowing down due to economic reasons, so it’s not exactly shocking to see that the shipping perk doesn’t have enough influence for people to maintain their subscriptions.
People cancel streaming subscription services because they go unused and/or are too expensive
Most people don’t cancel service because of problematic experiences or politics: the biggest reason almost 2 out of 3 people canceled streaming subscription services boils down to the price.

When looking at this multivariate set (users could select more than one reason if they reported canceling at least one service in a previous question), we see a few others detail emerge.
First, the most reported answer is simply because a service goes unused. When we isolate the data to look at those who select this answer, we can see some cooccurring details emerge.
It’s also worth noting that around 10% of people seem to cancel because of the volume of transactions it takes to maintain several streaming subscriptions – while it might still be economical, the perception of “having too many” has influenced some respondents’ choice to cancel at least one service.
Most people are happy with the amount they’re spending monthly for all services combined
Building a modular collection of streaming services is still perceived as economical, but each spending group has different sentiments toward their monthly expenditures when viewed individually.

We can see that a little more than half of the respondents (53%) now feel content with their aggregate monthly spending on all services combined.
However, this split shifts when you isolate certain groups. Perhaps the most notable change is found when examining different age groups.
We start to see the divide significantly widen once you start looking at respondents aged 35 and higher. As most tend to earn more each subsequent year of their lives, we see that people start to become more comfortable with their spending at 35 years of age and higher.
If you’re a streaming provider reading this and paying attention, you’ll likely find that this doesn’t mean it’s a good idea to raise prices. Under the age of 26, spending complacency is about a 50/50 split (i.e., technically, 53% to 47% when rounded to the nearest whole number), in the best-case scenario seen above when looking at this.
Your younger crowd might not be the biggest spenders but what they have to teach is invaluable –most of these 20-some-year-old people will eventually be 30-some-year-old people whose values will influence the direction of upcoming content for years to come.
Plus, all streaming providers are losing subscribers to other forms of mostly-free digital entertainment which we’ll cover in our extravagant grand finale.
Most people will deal with ads, especially Gen X
One way certain services provide users some control over their pricing is by including ads in exchange for reduced service pricing.

Almost exactly 50% of all 1005 respondents indicate that they’re happy to deal with ads in exchange for a better price for a video streaming service. Considering the mix of our sample, we can assume that the overall market sentiments toward ads in video streaming services (music and cable are outside the scope of our study) is likely quite close to the spread we see here.
This mentality may also apply to other takeaways from the data such as that only 19% will pay for an upgrade to remove the pricing, compared to 32% who will either delete or cease the use of a product altogether.
It should come as no surprise that once you start looking at specific groups, the attitude towards ads usually shifts.

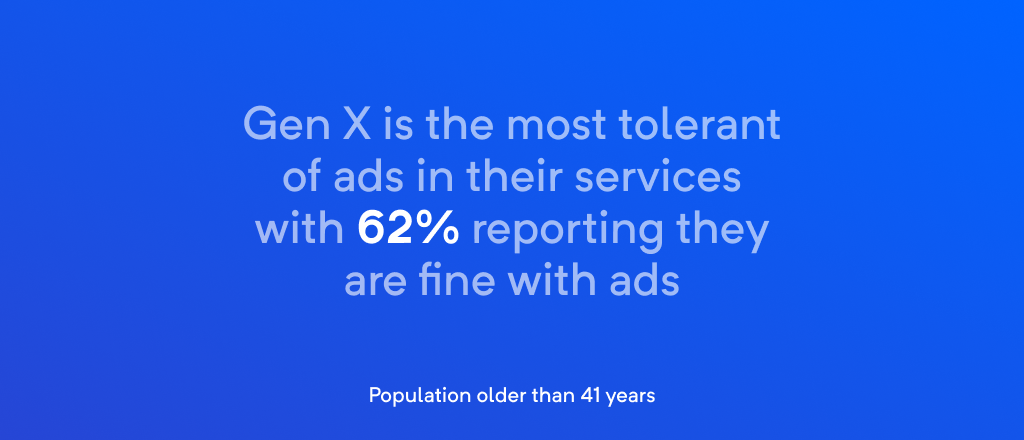
One of the more fun bits of information we uncovered is that the MTV generation is the most tolerant of ads in their services with 62% reporting they are fine with ads.
Though other trends indicate that spending complacency increases with age, this specific group appears to also be influenced by some degree of conditioning (i.e., they’re used to commercials) which could use further study.
What people are doing instead
One of the most interesting findings of our report is what our respondents report doing instead of streaming services.

A whole 3% of people report going to another paid streaming platform which tells us that what we’re seeing isn’t necessarily some shuffle up (e.g., everyone is canceling Amazon to subscribe to HBO Max), it’s just that people’s attentions are elsewhere.
With that said, the most popular digital alternative is the unpaid version of YouTube which is quite different from the professionally produced material found on other video streaming platforms.
We also see that many users are taking to social media platforms like Instagram (17%) and TikTok(14%) which are both highly visual and interactive which is something that video streaming services lack.
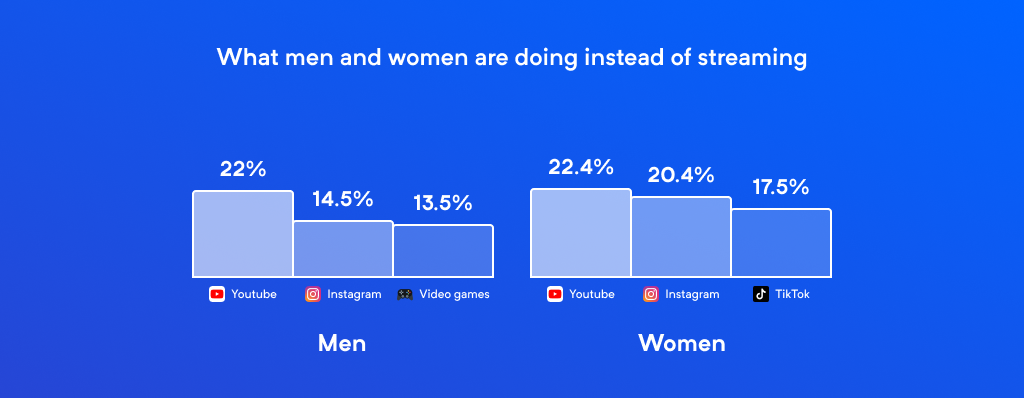
Finally, this is surprisingly one of just a couple of areas where we can find some degree of difference when comparing the answers of men to those of women.

Reported YouTube adoption stays about the same but there’s a bigger for women shift towards Tik Tok with 17% reporting intent to use the platform versus male-only respondents at 10%. Women surveyed also plan to adopt Instagram at a slightly higher rate than men at 20% compared to 15%.
For men, adoption of the live streaming platform, Twitch, is reported higher than for women at 11% and 7%, respectively. Men also report planning to adopt a game of some sort (15%) more so than women (5%).
Conclusion
Video streaming services, like every other business, are subject to everything from an individual perception of value to influences from economic conditions.
Right now, conditions point to fewer subscribers across the board as consumers seek to become solvent with streaming service spending.
We hope you enjoyed and of course, feel free to share.


