


How to Visualize Your App’s Google Play Store Metrics in Looker Studio
Android App Development

Iteration is the beating heart of the app development process. Of all the apps we’ve built, I can honestly say that none have come out looking or behaving like the app we envisioned when we began. Apps have this funny tendency to evolve and twist their way into something else by the time they find their groove. Building an app is less a straight-line path from idea to app, but more like a cycle of design, build, release and measure. To stoke the fires of iteration, we keep our release cycles short (3-6 weeks) and we use app usage data we gather from each release to drive what we do in the next cycle.
Well we could try sending comment cards and survey monkeys to people, but I wouldn’t hold my breathe on that. No my friends, to get insight we use mobile analytics to instrument every one of our apps so we can track exactly who is using our app, how they are using it and what they are doing with it.
For those of you who come from the web world, you probably have heard of Google Analytics. Google Analytics gives you incredible insight into the audience of your web site via traffic data gathered by Google. Mobile analytics suites like Flurry and Localytics to provide the app equivalent of what Google Analytics does for the web sites.
You wouldn’t launch a web site without connecting it to Google Analytics, then why would you release an app that didn’t plug into some instrumentation suite?
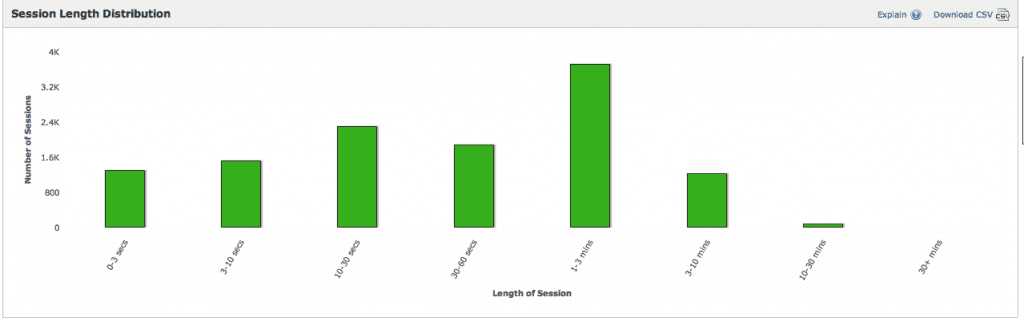
We use Flurry Analytics, and with that we get a free web-based dashboard that gives us deep insight into how people use our apps. Just by adding a very small amount of code we immediately gain insight into user retention rates, user growth rate, session lengths, user demographics, and a whole bunch of other usage data. With this data we get visibility into our user base and what pieces of functionality are resonating with them. This allows us to tinker, tweak or totally revamp our app’s in between releases with real data to support it.


I rarely speak in absolutes, but when it comes to mobile analytics and instrumentation there is no excuse for not incorporating something like Flurry into your app. It takes about 3 minutes to modify your app to work with something like Flurry and it’s free! Without instrumentation, the only thing data points you have to measure your app’s public reception is the number of downloads and app reviews it gets, which as Will Smith so eloquently stated is “just fishing in the dark, son.”
Read more about integrating Flurry into your app here. (No, this isn’t a sponsored post, I just woke up today and realized I really like Flurry)